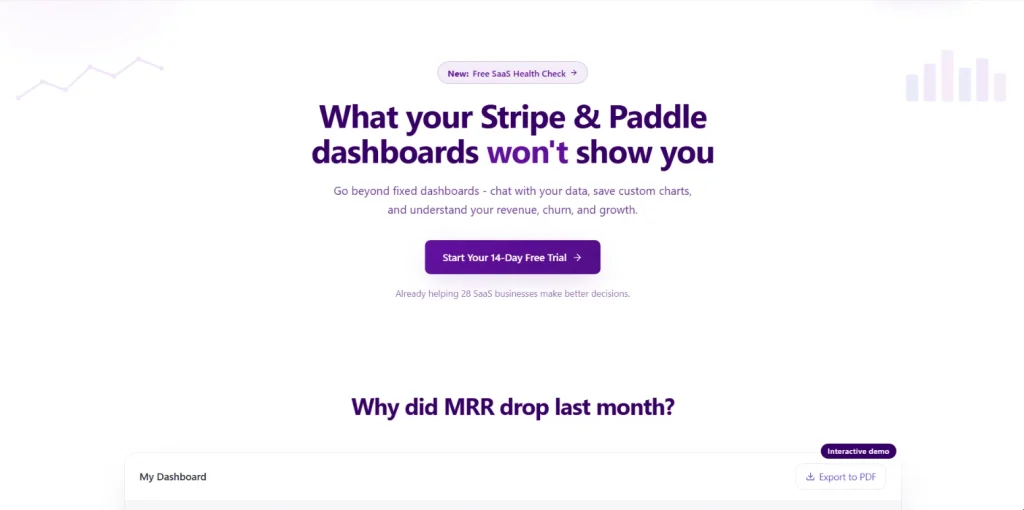
Chartsy is a new way of doing subscription analytics for SaaS businesses. Instead of overwhelming teams with static dashboards and complicated BI tools, Chartsy turns subscription data into a story about how the business is actually performing - what is growing, what is slowing down, where revenue is coming from, and which customers are most valuable.
By connecting Stripe or Paddle, businesses instantly get access to pre-built analytics dashboards for MRR, ARR, churn, retention, LTV, failed payments, refunds, subscription growth, and plan performance. One of Chartsy’s core features is its dedicated MRR dashboard breakdown, which helps businesses clearly understand how recurring revenue changes over time through upgrades, downgrades, new subscriptions, churn, reactivations, and expansion revenue.
The platform’s built-in AI analytics engine allows users to ask personalized questions about their own data in plain English. Instead of filtering spreadsheets or writing SQL queries, users can ask questions like.
Chartsy then generates instant charts, graphs, and explanations directly from the connected subscription data.
Research basis:
This is a source-based directory listing prepared from public product information; it is not represented as a hands-on test. Last updated August 4, 2026. Read our methodology.